Howe Sound Flare Watch

An independent air monitor is being set up in upper Britannia Beach, on the hillside facing the Woodfibre LNG flare stack across Howe Sound. It exists because no air monitoring has been committed for Britannia Beach. It is not here to oppose the project. The aim is to make sure Britannia Beach is heard and protected: a measured baseline before flaring starts, and a case for a proper, industry-standard monitoring station here.

Flare camera recording. Air sensor node being built, baseline starts this winter
Inversion layer caps the plume on calm nights About the same elevation · about 6 km across the water Britannia Beach monitor Woodfibre LNG flare Howe Sound · LNG carrier and tugs at berth
≈57 µg/m³Modelled NO₂ at Britannia Beach in a process upset, up from a 41.6 baseline. Under the B.C. objective (113) and the 2025 federal standard (79).
126.5 µg/m³Highest modelled NO₂, marked at the plant site, where it is above both limits. Modelled levels in the communities are lower.
1 stationThe entire modelled baseline comes from the Squamish provincial station.
29 Nov 2026Last day to comment on Woodfibre's air emissions permit application (WDA-Air). How to comment.

Please read: this is a resident's project, not an official or expert source, and not a campaign against Woodfibre LNG. Its sensors are low-cost and not regulatory grade. The information here is not necessarily correct, complete or up to date. Figures marked ≈ were read off charts, and Woodfibre's statements are summarised in our own words. Check the source boards and official sources before relying on anything here, and read the terms and legal notice.

Why this site exists

Because, as far as we can tell, no one has yet committed to measuring the air in Britannia Beach.

As far as Woodfibre LNG's public materials show (read 17 November 2026), the only air quality station named for the communities around the plant is the provincial station in Squamish. Woodfibre says additional community-based monitoring "is being considered", and that monitoring locations will be shared when its program is finalized (flaring FAQ, monitoring page).

Britannia Beach is one of the five communities assessed in Woodfibre's modelling. It has a direct view of the flare, and it is where Woodfibre predicts the greatest increase in sound. As far as we know, it has no official air quality station.

So a resident is building one. Something is better than nothing. The sensors here are low-cost and well below the standard a regulator or an industrial operator would use. They can show timing and patterns. They cannot show whether any limit was met or exceeded, and they are not a substitute for proper monitoring.

What Britannia Beach needs is an industry-standard monitoring station: continuous, regulatory-grade instruments like those at the provincial station in Squamish, run and calibrated by qualified people, in place before commissioning flaring begins, with the data public. Once that exists, the sensors on this site are only a cross-check.

The station

The station, now being built, is a small mast on a residential lot. Up top, a white louvred sun shield (stacked dishes) holds the particle sensor and the temperature/humidity sensor. A cup anemometer and a wind vane sit at the highest clear point. A sealed grey box holds the ESP32 controller and a passive NO₂ tube holder, and a camera on the same lot is zoomed in on the flare stack across the Sound. It will draw about 2 W from an ordinary outlet and report over Wi-Fi every two minutes.

ComponentMeasuresWhy
Radiation shieldPM1, PM2.5, PM10, temperature, humidity, pressureSmoke and particulates; humidity correction
Anemometer + vaneWind speed and directionWas the wind blowing from the plant?
NO₂ diffusion tubeMonthly average NO₂Lab-verified; NO₂ is the facility's main signal
Flare cameraA zoomed frame of the flare stack every minuteRecords when the flare is lit and for how long; matches every spike to a picture
ControllerESP32 + ESPHome to Home AssistantLogs raw data and feeds this page

Why upper Britannia Beach

  • Level with the flame, about 6 km away. The station is about 160 m (525 ft) above sea level. The flare stack is reported as 134 m tall (Squamish Chief, October 2026), and Woodfibre expects the flame to average up to 60 m above the tip during commissioning, so the station looks straight across at the tip and the lower part of the flame. On calm nights and in winter inversions a plume can travel level across the water. A hillside at that height is where it lands. Neither the shoreline nor the Squamish valley floor sees this.
  • Clear line of sight to the flare stack, so readings can be matched to photos.
  • Open water between plant and monitor. There's no terrain or town in between to muddy the signal.
  • It tests a published prediction. Britannia Beach is one of the five communities in Woodfibre's modelling, and it sits near the edge of the modelled 56.5 µg/m³ NO₂ contour.
  • It fills the baseline gap. Every prediction rests on one Squamish station. This adds a measured baseline on the side of the Sound that faces the plant.
  • Practical: power, Wi-Fi and a home server are already on site, and someone lives there to maintain it weekly.

Limits: flare plumes are hot and usually rise above stack height, so the site sees them mainly in stable air. The vane reads local hillside winds.

Live readings

No readings yet. The first node goes up this winter, and this panel fills in automatically.

Readings come from low-cost sensors and are indicative, not regulatory. PM2.5 uses the US EPA humidity correction. Raw data is kept and published unaltered.

Flare record

A camera on the same lot, zoomed in on where the flame will be, sends a frame every minute, and software checks each one for a lit flare. The latest frame is at the top of this page. This is in testing. The plant has not flared since the record began, so the detector has not yet seen a real flare. Its settings are a first guess and will be tuned on the first real flaring. Every frame it calls lit is kept so it can be checked by eye.

Flare monitor
—

Waiting for the camera feed.

When will the first flare be?

Woodfibre expects commissioning to begin in mid-2027 and to last six to eight months. It says flaring will then often happen several days a week, with single events lasting from under 15 minutes to more than a week, and that communities will be told at least 24 hours before planned flaring above regulatory thresholds.

A pilot flame of up to about one metre will burn all the time. Woodfibre says it may not be visible from a distance. Source: Woodfibre LNG flaring FAQ, read 17 Nov 2026.

Flare calendar

Watched, no flareUnder 30 min lit30 min to 2 hOver 2 hMostly no view

Hours lit per day, last 30 days

Limits: a camera sees flame, not emissions. It records when and how long the flare burns, not how much gas. A small flame in daylight is harder to pick out than one at night.

What's being built across the water

Woodfibre LNG is on the former Woodfibre pulp mill site on the west shore of Howe Sound, about 7 km southwest of Squamish. It liquefies pipeline natural gas for export by LNG carrier.

SourceWhat it doesEmissions controls (per Woodfibre)Regulated by
Thermal oxidizerDestroys waste gas, including acid gas and VOCs, at 982 °C instead of flaring or venting itLow-NOx burners; continuous emissions monitoring (CEMS) for SO₂ and NOxWoodfibre WDA-Air
Heat medium furnaceProcess heat; heating fluid circulates at ~300 °C and 180 °CUltra-low-NOx burnersWoodfibre WDA-Air
Flare stack (high- and low-pressure)Burns excess gas and relieves pressure during start-up, shutdown, maintenance and unplanned eventsSelf-adjusting nozzles, high exit velocity (VariJet), multi-nozzle tip to reduce black smokeWoodfibre WDA-Air
Electric compressorsRefrigeration compressors run on grid power instead of gas turbinesFewer shutdowns, so less restart flaringWoodfibre WDA-Air
Emergency diesel generator + diesel fire pumpsBackup power and fire water, e.g. during a power failureIntermittent, not routineWoodfibre WDA-Air
LNG carriers + tugsBerthing, loading, manoeuvringLow-sulphur fuelTransport Canada (separately)
FortisBC Squamish compressor stationCompresses gas in the supply pipelineIncluded only in the "cumulative" caseBCER, its own separate WDA

Two of the seven sources that affect our air aren't covered by Woodfibre's permit. Vessel emissions are a visible share of the modelled NO₂ increase.

The permit: WDA-Air

A Waste Discharge Authorization for air (WDA-Air) under B.C.'s Environmental Management Act sets enforceable limits on what the facility can release, including from flaring. The BC Energy Regulator (BCER) issues it.

Woodfibre submitted its application in late October 2026. Written comments are accepted for 30 days from 30 October, so until 29 November 2026. The application (PDF, 120 MB) is posted at woodfibrelng.ca.

Comments go to Woodfibre LNG, with a copy to the BCER. The addresses are under What you can do. Keep your own copy.

What the permit modelling includes

  • Pollutants: NOx/NO₂, SO₂, CO, PM2.5 (VOCs assessed separately for health)
  • The baseline from the Squamish provincial monitoring station
  • All facility sources, plus LNG carriers and tugs
  • FortisBC's compressor station, in the cumulative case only

Why Woodfibre calls it conservative

The model assumes vessels are present 24/7, every source runs at its maximum rate at once, and the weather is at its worst, all simultaneously. It reports the highest prediction over five years, not the average.

What's worth checking

Whether a valley-floor baseline from Squamish represents Britannia and Furry Creek, and whether the met data captures Howe Sound's outflow winds and inversions.

How the modelling was done

30,942
receptor points
40 × 40 km
model domain around the plant
43,800 h
of historical weather (5 years)
Peak
highest prediction used, not the average

Stantec ran the model for both the original Environmental Assessment and the newer WDA application. Communities assessed: Britannia Beach, Darrell Bay, Furry Creek, Squamish and Stá7mes.

Scenarios

PhaseCaseWhat's in it
Commissioning (6–8 months)Commissioning casePlanned flaring during liquefaction start-up, at the peak flared-gas rate
Stabilizing (years 1–2)Project aloneFurnace, thermal oxidizer, HP/LP flares (pilot, purge), design leaks, compressor seals, plus a higher rate of valves leaking to the flare
Application caseProject alone + marine vessels + baseline
Normal (year 3+)Project aloneThe same sources, without the extra leaking valves
Application caseProject alone + marine vessels + baseline
Cumulative caseApplication case + FortisBC Squamish compressor station

Non-routine events

EventWhat happensWhat we watch for
Process upset / tripUnplanned flaring after a power failure, until the plant has started up again.NO₂, PM spike, visible flare
Thermal oxidizer: high inlet sulphurMaximum sulphur in pipeline gas, including the added odorant mercaptans: 45 ppmv vs 24 ppmv normally, so more SO₂SO₂
Thermal oxidizer trip: flaring + ventingWith the oxidizer down, acid gas and high-pressure flash gas go to the flare and are ventedRotten-egg or cabbage smell, PM, visible flare

Modelled results at Britannia Beach

Each bar is the existing baseline (measured in Squamish) plus the added contribution from the facility and vessels, compared with the objective lines. Pick a scenario:

Baseline (Squamish station)Added by facility + vesselsB.C. Air Quality Objective2025 federal standard (CAAQS)

≈ Values read from unlabelled bar charts on the open-house "WDA Dispersion Modelling Results" board, accurate to about ±3 µg/m³. Squamish, Stá7mes and Darrell Bay show very similar bars. The actual table is one of our questions for Woodfibre.

NO₂ is the signal

Process upsets add roughly 15 µg/m³ on top of the baseline. Vessels and the facility both contribute. The modelled total stays under the 2025 federal standard at Britannia, but with less room than the 113 objective suggests.

PM2.5 is mostly background

The baseline is already 17.7 of 25 µg/m³, about 71% of the objective, before the plant runs. The facility adds under 1. Woodfibre says the baseline reflects home heating, vehicles and buildings.

SO₂ is small

About 12–17 µg/m³ against the 170 shown as the objective. The high-sulphur case is the highest. Odour from venting is a separate issue and wasn't shown.

Woodfibre's NO₂ maps

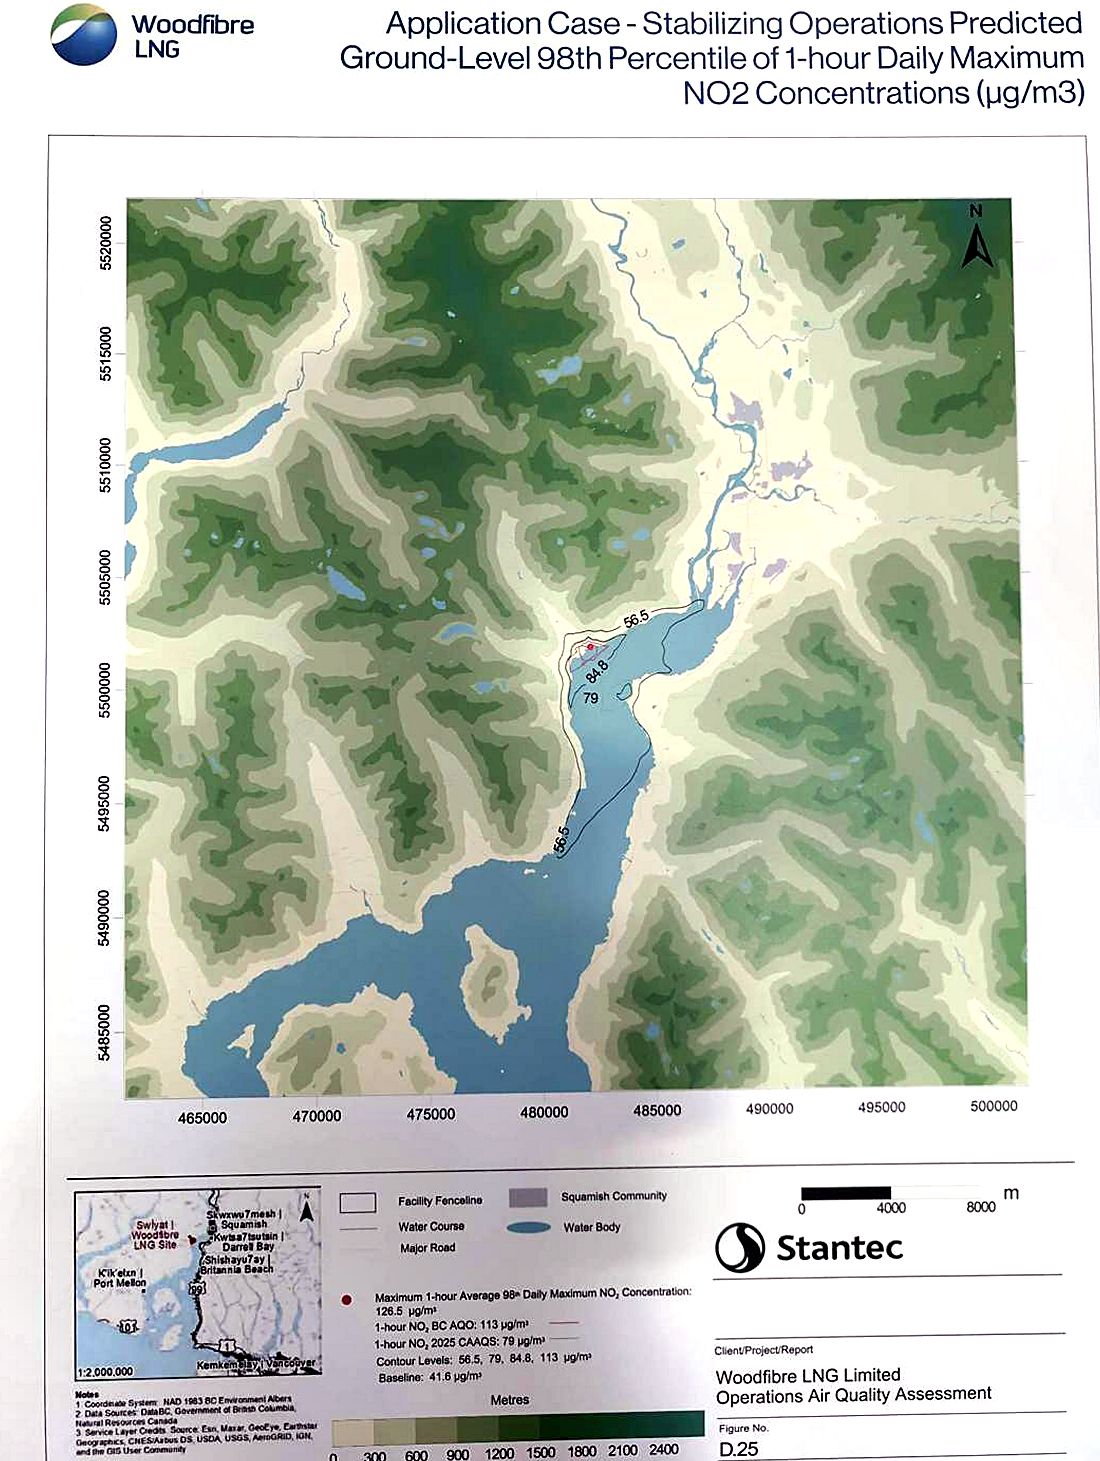
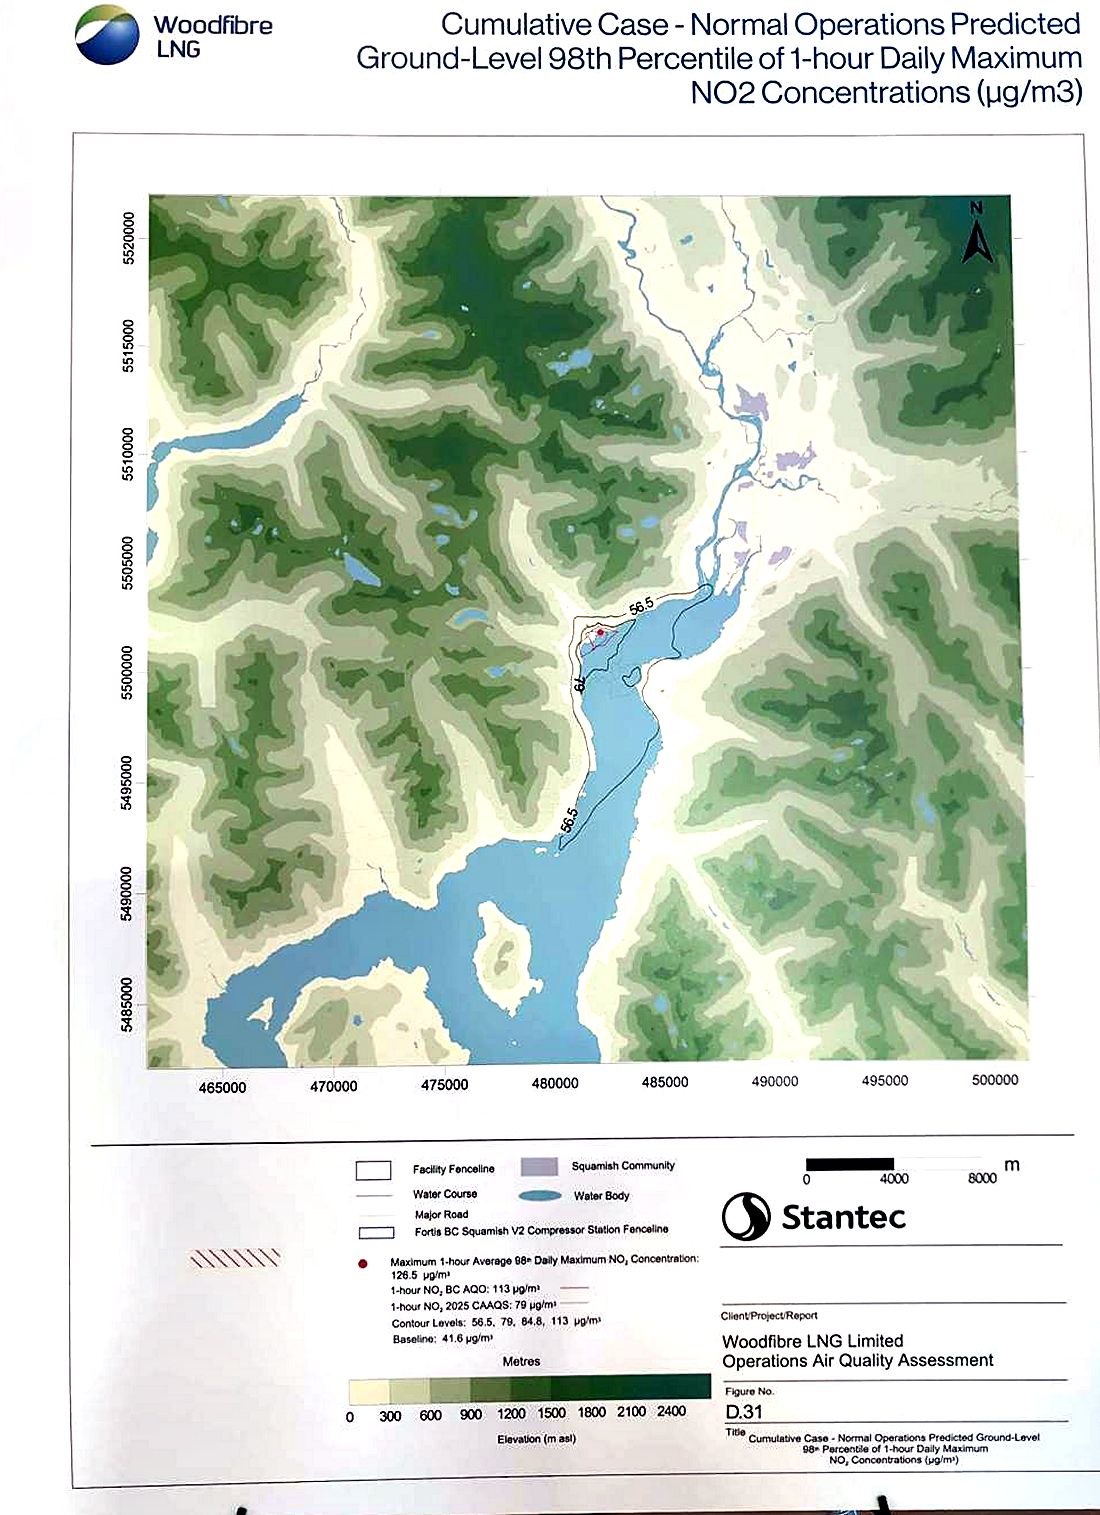
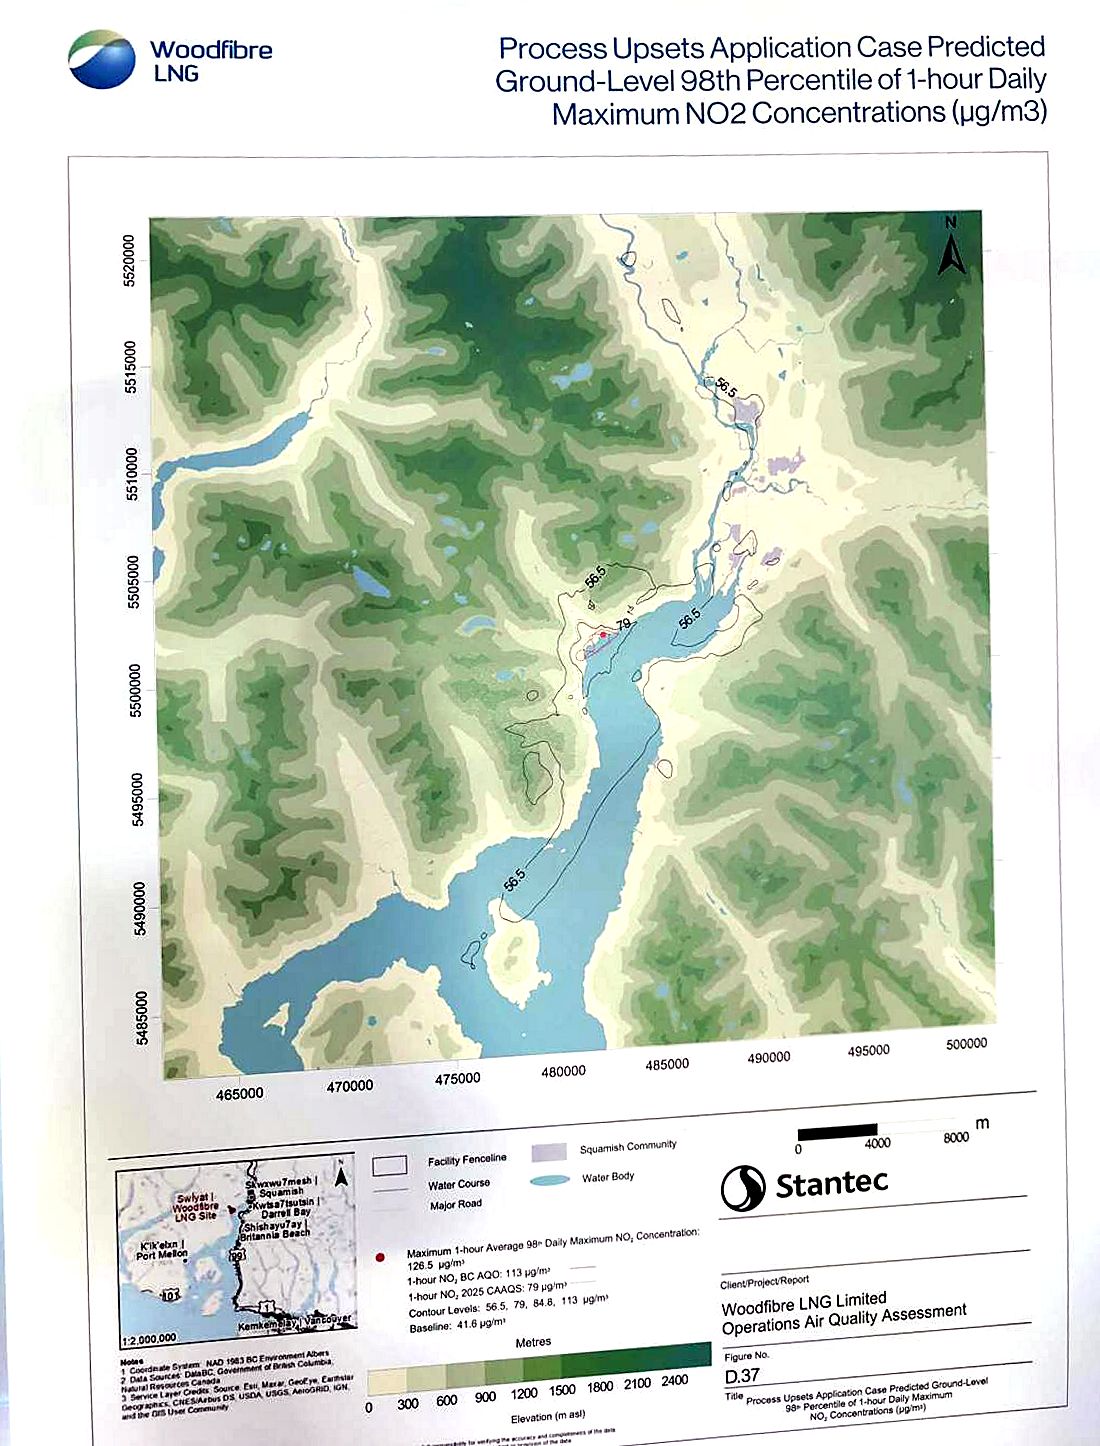
Stantec's figures show the 98th percentile of the daily 1-hour maximum NO₂. Contour lines are at 56.5 (half the B.C. objective), 79 (2025 CAAQS), 84.8 and 113 µg/m³ (B.C. objective). Every map lists a baseline of 41.6 and a maximum of 126.5 µg/m³, marked at the plant site.

Figure D.25 NO2 contour map, stabilizing operations
D.25 Stabilizing operations. The 56.5 contour fills the upper Sound from Darrell Bay south past Britannia. Britannia sits on or near its edge.
Figure D.31 NO2 contour map, cumulative case
D.31 Cumulative case (with the FortisBC compressor station). A similar footprint. The 79 contour hugs the west shore.
Figure D.37 NO2 contour map, process upsets
D.37 Process upsets. Much wider: 56.5 patches reach Squamish town, the Squamish River valley, the west-side hills and south toward Anvil Island.

All three maps list the same 126.5 maximum, including the upset case. That may be a copied legend. It is one of our questions.

What Woodfibre says about health

Woodfibre's Human Health board says:

  • Maximum predicted hourly NO₂ and SO₂ in communities are below WHO guidelines and B.C. objectives, so health risks are "expected to be negligible."
  • Predicted VOCs are far below screening levels in every scenario, in some cases 1,000 to 1,000,000 times lower.
  • Pollutants assessed: NO₂, SO₂, PM2.5, CO and VOCs.
  • "Detectable vs harmful": flaring may be visible, audible or measurable without being harmful.

What we'll measure

Woodfibre's statementWhat we'll measure
Community levels stay below objectives, even when flaringHourly PM2.5 now; monthly NO₂ tubes; hourly NO₂ in phase 3
Flaring has "little to no effect" on community airCompare flaring days with non-flaring days, filtered by wind direction
Residents already get more from local sources (cars, boats, heating) than they would from the facilityA pre-operation baseline is exactly this comparison
New flare tip reduces black smokeCamera + PM during flaring events
Which WHO value was usedOne of our questions. WHO's 2021 NO₂ guideline is 25 µg/m³ over 24 hours and 10 over a year. Its 1-hour value, from 2005, is 200, which is higher than B.C.'s 113.

Acidification and nutrient effects

NOx and SO₂ come back down in rain, snow and fog. Woodfibre assessed this against site-specific "critical loads": how much a given patch of soil or water can absorb before it changes.

32 ha
near the plant: predicted 13% loss of lichen species richness and 26% loss of forage lichen
120–128 ha
where soil acidity thresholds are exceeded, near the plant and up the Squamish River valley
0.6–0.7 %
of the local study area over forest and wetland nitrogen thresholds
4 sites
on Mill Creek and Woodfibre Creek; no critical-load exceedance predicted (one water-quality anomaly, Jan 2025)

The Squamish River valley soil finding lines up with the process-upset map: emissions travel up-valley.

Woodfibre's monitoring plan

  1. At the source: meters and gas-composition analyzers on the flare and furnace. Emissions are calculated from these, not measured in the air.
  2. CEMS on the thermal oxidizer: continuous SO₂, NOx and other parameters.
  3. Community: the existing Squamish station. Additional community monitoring is "being considered." Woodfibre says it wants community input.

An Air Quality Mitigation and Monitoring Plan must be in place before flaring begins. It's being developed with the BCER, Sḵwx̱wú7mesh Úxwumixw, provincial health and environment agencies, and Vancouver Coastal Health. If monitoring shows higher levels than predicted, Woodfibre says it will investigate and apply "adaptive management."

Still open for Britannia Beach

Going by the open-house boards, these are not settled yet:

  • No committed monitor in Britannia Beach, Furry Creek or Darrell Bay.
  • No commitment to publish data in real time, whether CEMS readings, flare volumes or community readings.
  • No stated trigger level for when "adaptive management" starts, or who decides.
  • No mention of odour monitoring (H₂S, mercaptans) despite the venting scenario.
  • Vessel emissions fall under Transport Canada, outside this permit.

The monitoring plan isn't final, and Woodfibre says it wants community input. This station is one contribution. Ask for the rest to be written into the plan.

Timeline

  1. WDA-Air application filed with the BCER. The 30-day public comment period runs from 30 October.
  2. Open house in Britannia Beach. Woodfibre presents its modelling and asks for input on local monitoring. This site's flare camera starts recording the same day.
  3. Public comments close. How to comment.
  4. Second open house in Britannia Beach, Community Hall, 4:30 to 7:30 p.m.
  5. This station goes up and starts recording the pre-operation baseline.
  6. Air Quality Mitigation and Monitoring Plan finalized.
  7. Commissioning expected to begin, lasting six to eight months, with planned flaring at peak rates several days a week.
  8. Stabilizing operations, with more gas reaching the flare through leaking valves.
  9. Normal operations, plus occasional upsets and venting events.

What you can do

  1. Comment on the WDA-Air application by 29 November 2026. Woodfibre filed it in late October and gives 30 days from 30 October for written comments. Email yours to Woodfibre LNG at info@wlng.ca, with a copy to the BC Energy Regulator at waste.management@bc-er.ca. Start from the template on this page, put it in your own words, and add what matters to you. Read the Environmental Protection Notice (PDF) or the full application (PDF, 120 MB).
  2. Ask for an industry-standard monitoring station in Britannia Beach and in Furry Creek: regulatory-grade, continuous, in place before flaring starts, with public data. The monitoring plan isn't final, so this is the time to ask.
  3. Log flares, smoke and odours with the form below.
  4. Host a node. Furry Creek, Darrell Bay and upper Britannia are the most useful sites.
  5. Come to the next open house and ask the questions listed here. Britannia Beach Community Hall: Wednesday 2 December 2026. Executive Suites, Squamish: Thursday 19 November and Thursday 3 December. All run 4:30 to 7:30 p.m.

Comment template

Re: Woodfibre LNG WDA-Air application

I live in [community]. I'm asking that the permit and the Air Quality Mitigation and Monitoring Plan include:

1. A continuous, regulatory-grade community air monitoring station in Britannia Beach (and Furry Creek), with instruments and quality assurance equivalent to the provincial station in Squamish, measuring NO2, SO2, PM2.5 and H2S, installed before commissioning flaring starts.
2. Real-time public reporting of community monitoring data, thermal oxidizer CEMS data and flared-gas volumes.
3. Compliance assessed against the 2025 Canadian Ambient Air Quality Standards (NO2 1-hour: 79 ug/m3), not only B.C. objectives.
4. Defined trigger levels for adaptive management, with public notification.
5. Advance public notice of planned flaring, and prompt notice of unplanned flaring and venting.
6. Publication of the actual modelled values for each community and scenario.

No air monitoring is currently committed for Britannia Beach. The modelled baseline comes only from the Squamish station. A measured baseline for communities across the Sound is needed to check the predictions, and low-cost sensors run by residents are not a substitute for an industry-standard station.

[Name, address]

Questions for Woodfibre

    Log a flare, smoke or odour

    Fill this in to create a timestamped entry, then copy it into your notes or send it to the community log. Nothing is sent from this page. Entries are saved in this browser so you can build up a list.

    Your log

    No entries yet.

    Build your own node for under $200

    The design is open: an ESP32 running ESPHome, feeding Home Assistant. Parts below link to amazon.ca searches; pick a seller with good reviews. Every extra node around the Sound makes the picture sharper.

    PartMeasures / job≈ CAD

    Wiring

    PMS5003 TX/RX to GPIO16/17 (5 V power). BME280 I²C on GPIO21/22. Anemometer reed switch on GPIO27 with an internal pull-up. Vane resistor ladder on GPIO34 with a 10 kΩ resistor to 3.3 V.

    Mounting

    Sensors go in the vented shield, 2–4 m up, away from walls, vents, BBQs and chimneys. The vane goes highest, with its N mark aligned to true north (declination here is about 15° E).

    Next phases

    Phase 2: an electrochemical H₂S sensor on the ADS1115, for venting events. Phase 3: an Alphasense NO2-B43F and SO2-B4 for hourly NO₂ and SO₂ (~$500+).

    Methods and data quality

    • PM2.5: a Plantower PMS5003, the same sensor family as PurpleAir. Corrected with the US EPA formula: 0.524 × CF1 − 0.0862 × RH + 5.75. Both raw and corrected values are kept.
    • NO₂: passive diffusion tubes exposed for 2–4 weeks and analysed by a lab. They give accurate averages but not hourly peaks.
    • Calibration (planned): 1–2 weeks co-located with the Squamish provincial station, then a linear correction fitted against its published hourly data. Repeated yearly.
    • Flare record (in testing): each one-minute camera frame is searched for a compact patch of bright orange, which at night must also have a burnt-out bright core. Three lit frames in a row open an event, and gaps of up to three minutes do not end it. A frame with nothing to see in it counts as no view, not as no flare. Every lit frame is kept, with extra frames every 15 seconds while it is lit and the ten minutes either side.
    • Attribution: a spike is only linked to the facility when wind direction, timing and camera or flare-log evidence agree.
    • Limits: low-cost sensors are indicative, not regulatory. Cheap metal-oxide gas sensors aren't used for published numbers.

    Reference values

    PollutantAveragingValue (µg/m³)Source
    NO₂1 h113B.C. objective
    NO₂1 h792025 CAAQS
    SO₂1 h170As shown by Woodfibre
    PM2.524 h25B.C. objective
    PM2.5annual8B.C. objective

    Check current values against BC ENV and CCME before quoting them.

    Glossary

    AQO
    B.C. Ambient Air Quality Objective. Non-statutory provincial limits used to judge emissions.
    CAAQS
    Canadian Ambient Air Quality Standards. Federal standards; the 2025 NO₂ 1-hour value (79 µg/m³) is stricter than B.C.'s.
    WDA-Air
    Waste Discharge Authorization for air. The permit that sets enforceable emission limits.
    BCER
    BC Energy Regulator. Issues the WDA and regulates LNG facilities and pipelines.
    CEMS
    Continuous Emissions Monitoring System. Instruments in a stack that measure emissions continuously.
    98th percentile
    The value exceeded on only 2% of days, about 7 days a year. It filters out the rarest extremes.
    µg/m³ / ppb
    Micrograms per cubic metre / parts per billion. For NO₂, 1 ppb ≈ 1.88 µg/m³.
    Inversion
    A warm air layer over cold air that traps pollution near the ground or at one height. Common in Howe Sound in winter.
    Thermal oxidizer
    A high-temperature burner that destroys waste gas instead of flaring or venting it.
    Mercaptan
    The sulphur odorant added to natural gas (the "gas leak" smell). Burned, it makes SO₂. Vented, people can smell it at extremely low levels.
    Critical load
    How much acid or nitrogen deposition an ecosystem can absorb before harmful change.

    Source documents

    Photos of the eleven Woodfibre LNG open-house boards (17 November 2026), reproduced here for public reference and comment. The photos were cropped, straightened and colour-corrected so they are easier to read; nothing else was changed. Tap one to open it full size.

    Official documents and news coverage

    Outside links, checked on 17 November 2026. We don't control them and they may move.